Important things in Oracle AWR (Automatic Workload Repository) report
Source : http://www.perfluent.com/nirvana--it/a-laymans-guide-to-quickly-interpreting-oracle-awr-reports
If you have worked in IT long enough then it is hard to miss the acronym "AWR". AWR is short for Automatic Workload Repository report and is probably the first word out of a DBA's mouth at the mention of performance problems in your application. If you are like most people then your head would start spinning when you perchance happen to glance the report. You are not alone, most DBAs don't understand 90% of what is in the report and how to make sense of it. Most times the DBAs tend to look at such reports with a preconceived bias since they are looking for patterns most are familiar with like full table scans, too much CPU use or too much disk I/O, etc and then lean the findings accordingly. So what is a layman with reasonable intelligence to do when you see the report and how does one validate what the DBA is saying.
So here goes....Before we do anything a little history... AWR is the Pièce de résistance of what is called as Oracle Wait Interface (OWI), one of the features that sets Oracle apart from the other databases. So while evolving the Oracle engine over the many years, Oracle realized the importance of measuring every touch point of a SQL as it progress through the Oracle RDBMS engine. The OWI was the result, this was initially very cumbersome to read, analyze and diagnose. As releases of Oracle have come and gone they have fine tuned the OWI such that today it produces a neat report (default every hour) recording all activities in the database and capturing every wait event the SQLs were subjected to. No special switch or extra software is required since Oracle 10g onwards the AWR is ready to go out of the box. The DBA can control the frequency of the report generation based on need and you also control the retention period of the records so that you can go back in time if needed.
Ok coming back to reading the AWR, the first thing you want to make sure is - If the issue is really caused by the DB? To do this the best thing to do is to glance at the DB Time which is reported at the very start of the report.
At the very bottom I have culled out 4 tables from the numerous that you would encounter in an AWR report to illustrate how you can make a fairly good inference based on glancing a few key data points instead of getting intimidated by the sea of data in an AWR report. We will refer to this data below for our analysis.
Let's start with the first table. Looking at the 180 mins of elapsed time (meaning this report is for 3 hrs), the application is roughly spending 320 mins on the DB. What this implies is that roughly 320/180 = 1.8 DB Seconds is being spent for every elapsed second. Confusing? In a DB there are thousands of transactions at any given second and servers have more than one CPU so multiple transactions can run in parallel. For example if we ran 2 transactions a second, the DB Time would be 2 seconds, 10 transactions in a second implies 10 DB seconds and so on. Which is why you see DB Time being more than the wall clock, in our case 320 DB Minutes in 180 wall clock minutes. DB Time is the total time spent by sessions in the DB doing active work which include time spent on CPU, I/O and other waits. Consequently the higher the DB Time for a given hour for example, higher the load on the DB. So for a 60 min period if you saw the DB Time as 600 mins, then that implies a busier DB because you are executing more transaction concurrently in a given minute.
Now let's move on to the second table. Here if you look at DB time spent in a second, you will see that it is 1.8 DB seconds, meaning on avg, there are about 1.8 sessions active in the database doing real work. For example in our case DB Time of 320, divided by wall clock of 180 mins give you roughly 1.8 sessions active sessions per second. The higher the number of active sessions in a given second the more the load on the DB.
To cross check, search for "user commits" in the report or Table 3 below.
So in the 3 hour period we had about 12000 transactions, this times the 1.6 DB seconds per transaction (column 3 of Table 2) will give you back the 320 DB mins spent by the DB executing SQLs. Obviously you want the DB Time spent per transaction to be as small as possible.
Now, we have to see if we can break down this DB Time into its components, how is this time distributed, meaning how many seconds did the SQL spend executing on the CPU, doing I/O or waiting for a lock (enqueues, latches etc are too complicated for now, just imagine them all as being similar to locks primarily use to control concurrency to common objects like tables, rows, etc). I am also excluding interconnect latency, network etc from our discussion for now.
First search for "Top 5 Timed Foreground Events" in the report or look at Table 4 below. Now, look at the % DB Time column, pay attention to those that have a higher value for this column since these are the prime drivers of DB Time. In the above example you can see that almost 40+28=68% of DB Time is consumed by the 2 top events. Both of these are I/O related. So now at least you know where to look, are your SQLs returning too many rows, is the I/O response pretty bad on the server, is DB not sized to cache enough result sets, etc.
The 3rd row in Table 4 indicates 19% of DB Time is spent on row locks, meaning you have sessions wanting to change same set of rows but cannot do so all at once until the holder of the lock doing the change finishes. This indicates a code problem, check for unnecessary access to same rows or single row table to implement serialization, usually applications at the start of transaction update a master table or something and then go do a bunch of stuff before coming back and committing or rolling back the update on the master table. In apps that have a lot of sessions this will cause a backup of waiting sessions because the locks are not released fast enough, eventually your apps server will run out of connection threads and the whole thing stops.
Now, the 4th row in Table 4, DB CPU is critical, in CPU bound databases you will see this as the top event. There is a very easy way to see how much CPU is used by the DB. DB CPU was about 2335s or 39 mins for the whole 3 hours. So 39 mins out of a total DB Time of 320 mins is only 12% and now we can conclude that in our example above most of our DB Time is spent doing I/O.
Another interesting tidbit is this, look for "Host CPU" in the report to look for the number of CPUs on the DB server:
Host CPU (CPUs: 6 Cores: 3 Sockets: )
So we have 6 cores, meaning in a 60 min hour we have 60 X 6 = 360 CPU mins, so for 3 hours we have 1080 CPU mins and we used only 39 CPU mins, meaning only 39/1080 = 3.6% of all available CPU on the box! Tiny indeed! If you had a CPU bound DB, you would probably see DB CPU more like 900 - 1000 mins, and that is not a good sign. Usually indicates contention for latches or you have SQLs doing too many logical I/Os or lot of parsing due to the application not using bind variables, etc. More on these later but at the very least I hope this write-up gives you the ability to quickly look at a few data points and infer what is ailing performance of your database.


AWR:
Source : http://www.dba-oracle.com/t_how_to_read_an_awr_report.htm
Reading the AWR Report
This section contains detailed guidance for evaluating each section of an AWR report. The data in an AWR report is the delta, or changes, between the accumulated metrics within each snapshot. Reading an AWR report id difficult because most of the metrics are undocumented because the AWR report was originally designed for Oracle support internal-use only.
The main sections in an AWR report include:
Report Summary: This gives an overall summary of the instance during the snapshot period, and it contains important aggregate summary information.
Cache Sizes (end): This shows the size of each SGA region after AMM has changed them. This information can be compared to the original init.ora parameters at the end of the AWR report.
Load Profile: This important section shows important rates expressed in units of per second and transactions per second.
Instance Efficiency Percentages: With a target of 100%, these are high-level ratios for activity in the SGA.
Shared Pool Statistics: This is a good summary of changes to the shared pool during the snapshot period.
Top 5 Timed Events: This is the most important section in the AWR report. It shows the top wait events and can quickly show the overall database bottleneck.
Wait Events Statistics Section: This section shows a breakdown of the main wait events in the database including foreground and background database wait events as well as time model, operating system, service, and wait classes statistics.
Wait Events: This AWR report section provides more detailed wait event information for foreground user processes which includes Top 5 wait events and many other wait events that occurred during the snapshot interval.
Background Wait Events: This section is relevant to the background process wait events.
Time Model Statistics: Time mode statistics report how database-processing time is spent. This section contains detailed timing information on particular components participating in database processing.
Operating System Statistics: The stress on the Oracle server is important, and this section shows the main external resources including I/O, CPU, memory, and network usage.
Service Statistics: The service statistics section gives information about how particular services configured in the database are operating.
SQL Section: This section displays top SQL, ordered by important SQL execution metrics.
SQL Ordered by Elapsed Time: Includes SQL statements that took significant execution time during processing.
SQL Ordered by CPU Time: Includes SQL statements that consumed significant CPU time during its processing.
SQL Ordered by Gets: These SQLs performed a high number of logical reads while retrieving data.
SQL Ordered by Reads: These SQLs performed a high number of physical disk reads while retrieving data.
SQL Ordered by Parse Calls: These SQLs experienced a high number of reparsing operations.
SQL Ordered by Sharable Memory: Includes SQL statements cursors which consumed a large amount of SGA shared pool memory.
SQL Ordered by Version Count: These SQLs have a large number of versions in shared pool for some reason.
Instance Activity Stats: This section contains statistical information describing how the database operated during the snapshot period.
Instance Activity Stats (Absolute Values): This section contains statistics that have absolute values not derived from end and start snapshots.
Instance Activity Stats (Thread Activity): This report section reports a log switch activity statistic.
I/O Section: This section shows the all important I/O activity for the instance and shows I/O activity by tablespace, data file, and includes buffer pool statistics.
Tablespace IO Stats
File IO Stats
Buffer Pool Statistics
Advisory Section: This section show details of the advisories for the buffer, shared pool, PGA and Java pool.
Buffer Pool Advisory
PGA Aggr Summary: PGA Aggr Target Stats; PGA Aggr Target Histogram; and PGA Memory Advisory.
Shared Pool Advisory
Java Pool Advisory
Buffer Wait Statistics: This important section shows buffer cache waits statistics.
Enqueue Activity: This important section shows how enqueue operates in the database. Enqueues are special internal structures which provide concurrent access to various database resources.
Undo Segment Summary: This section gives a summary about how undo segments are used by the database.
Undo Segment Stats: This section shows detailed history information about undo segment activity.
Latch Activity: This section shows details about latch statistics. Latches are a lightweight serialization mechanism that is used to single-thread access to internal Oracle structures.
Latch Sleep Breakdown
Latch Miss Sources
Parent Latch Statistics
Child Latch Statistics
Segment Section: This report section provides details about hot segments using the following criteria:
Segments by Logical Reads: Includes top segments which experienced high number of logical reads.
Segments by Physical Reads: Includes top segments which experienced high number of disk physical reads.
Segments by Buffer Busy Waits: These segments have the largest number of buffer waits caused by their data blocks.
Segments by Row Lock Waits: Includes segments that had a large number of row locks on their data.
Segments by ITL Waits: Includes segments that had a large contention for Interested Transaction List (ITL). The contention for ITL can be reduced by increasing INITRANS storage parameter of the table.
Dictionary Cache Stats: This section exposes details about how the data dictionary cache is operating.
Library Cache Activity: Includes library cache statistics describing how shared library objects are managed by Oracle.
SGA Memory Summary: This section provides summary information about various SGA regions.
init.ora Parameters: This section shows the original init.ora parameters for the instance during the snapshot period.
Source :http://nonfunctionaltestingtools.blogspot.com/2015/04/steps-to-analyze-awr-report-in-oracle.html#!/2015/04/steps-to-analyze-awr-report-in-oracle.html
Steps to Analyze AWR Report in Oracle
AWR - Automatic workload repository is a collection of persistent system performance statistics owned by SYS. It resides in SYSAUX tablespace. Bydefault snapshot are generated once every 60 min and maintained for 7 days. Each snapshot has a unique ID know as "snap_id". Snapshot detail can be found in "dba_hist_snapshot" view.
If we have Database performance issue and not the Database machine, then AWR Report is the place to look at. AWR is not used for real-time performance monitoring like the v$ tables. It is used for historical analysis of performance. AWR complements, but doesnot replace real-time monitoring.
Once AWR Report is generated in Oracle, the next task is to analyze it. By going through the AWR Report we can easily solve issues like slow database, high wait events, slow query and many more issues. Even though the report is lengthy, Analyzing or Reading relevant part of AWR Report can help to troubleshoot issues in easy and fast manner.
In case if a particular query is not performing well, look at execution plan of the query, stats of underlying table etc. In this case AWR won't help much.
General Tips before getting an AWR Report.
1. Collect Multiple AWR Reports: It's always suggested to have two AWR Reports, one for good time (when database was performing well), second when performance is poor. This way we can easily compare good and bad report to find out the culprit.
2. Stick to Particular Time: Always take the report during the time when the Database is performing slow. We have to have a specific time like Database was slow today at 10Am and continued till 2Pm. Here, we can get a report for these four hours.
3. Split Large AWR Report into Smaller Reports: Instead of having one report for long time like one report for 4hrs. it's is better to have four reports each for one hour. This will help to isolate the problem.
Now, let us walkthrough the report. Since, AWR report is a huge report and area to look into AWR is also depends on problem to problem. Here, I am listing most common area for a Performance Engineer to look into which will give a clear picture of the issue.
Steps to Analyze AWR Report:
< !--[if !supportLineBreakNewLine]-->
< !--[endif]-->
Note: The Report is obtained using OEM with Oracle Release 12.1.0.1.0
1. Database Details:
After getting an AWR Report check the report generated is for the problematic DB. The details are shown in Top part of the report.
In this part cross check for database and instance and and database version with the Database having performance issue. This report shows RAC = NO if it is not a RAC DB.
2. Host Configuration:
This will give you name, platform CUP, socket and RAM etc. Important thing to notice is that the configuration like CPU and Memory has not changed when the performance is degraded.
<!--[if !vml]--><!--[endif]-->
3. Snap Shot Detail:This are the detail about snap shot taken, Snap start time and end time. Difference between them is as "Elapsed".
<!--[if !vml]--><!--[endif]-->
< !--[if !supportLineBreakNewLine]-->
< !--[endif]-->
DB Time= session time spent in database.
DB Time= CPU Time + Non IDLE wait time.
In Systems with multiple concurrent active sessions, DB time can be larger than elapsed time. We can see that DB time is very large as compared to Elapse time, which is not a concern. Check if you have taken a report for the time having performance problem. If yes fine, otherwise take a report for performance problem time.
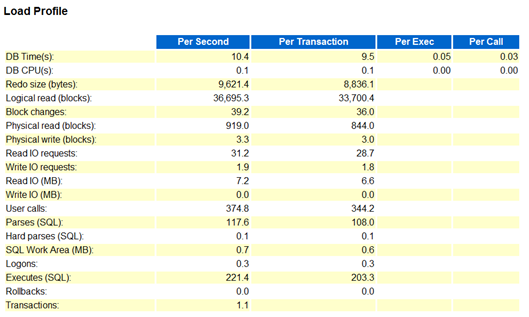
4. Load Profile:
Here are few important stats to look into. First is "DB CPU(s)" per second. Before that let's understand how DB CPU's work. Suppose you have 8 cores into the system. So, per wall clock second you have 8 seconds to work on CPU.
< !--[if !supportLineBreakNewLine]-->
< !--[endif]-->
So, if "DB CPU(s)" per second in this report > cores in (Host Configuration (#2)) means env is CPU bound and either need more CPU's or need to further check is this happening all the time or just for a fraction of time.
In this case, machine has 8 cores and DB CPU(s) per second is 0.1. So, this is not a CPU bound case.
Next look at Parses and Hard parses. If the ratio of Hard parses to Parses is high, this means Database is performing more Hard parses. In that case we needs to look at parameters like cursor_sharing and application level for bind variables etc.
In the above we have no issue with parses.
Parse issues usually occur as a result of:
Bad Bind variables usage
<!--[endif]-->Insufficient memory
Will also be co-indicated by low percentage of memory for multiple SQL execution.
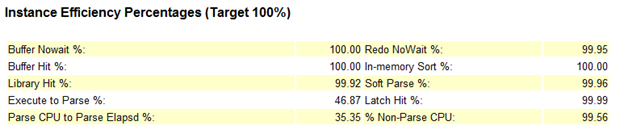
5. Instance Efficiency Percentages:
Note: DB Tuning must never be driven by the Hit ratios. These only provide additional information for help to understand how the instance is operating.
Meanings of particular Hit Ratios:
<!--[if !supportLists]-->a. <!--[endif]-->Buffer Nowait%: Shows the % of times when data buffers were accessed directly without any wait time.
<!--[if !supportLists]-->b. <!--[endif]-->Buffer Hit Ratio : Measures how many times a required block was found in memory rather than having to execute an expensive read operation on disk to get the block.
<!--[if !supportLists]-->c. <!--[endif]-->Library Hit%: Shows the % of times when SQL statements and PL/SQL packages were found in the shared pool.
<!--[if !supportLists]-->d. <!--[endif]-->Execute to Parse %: Shows how often parsed SQL statements are reused without re-parsing.
<!--[if !supportLists]-->e. <!--[endif]-->Parse CPU to Parse Elapsed %: Gives the ratio of CPU time spent to parse SQL statements.
<!--[if !supportLists]-->f. <!--[endif]-->Redo NoWait %: Shows whether the redo log buffer has sufficient size.
<!--[if !supportLists]-->g. <!--[endif]-->In-memory Sort %: Shows the percentage of times when sorts are performed in memory instead of using temporary tablespaces.
<!--[if !supportLists]-->h. <!--[endif]-->Soft Parse % : Shows how often sessions issued a SQL statements that is already in the shared pool and how it can use an existing version of the statement.
<!--[if !supportLists]-->i. <!--[endif]-->Latch Hit %: Shows how often latches were acquired without having to wait.
<!--[if !supportLists]-->j. <!--[endif]-->% Non-Parse CPU : Shows the percentage of how much CPU resources were spent on the actual SQL execution.
In these statistics, you have to look at
Soft Parse % ~ 100% indicates that the SQL statements are actively re-used.
"% Non-Parse CPU". ~ 100% means most of the CPU resources are used into operations other than parsing, which is good for database health.
Parse CPU to parse Elapsed % : It is very low, it reveals that oracle waits for some resources during parsing of SQL statements. To be investigated further.
Rule of thumb: Always minimize the number of Hard parses. This reduction yields the benefits of minimizing CPU overhead spent performing costly parse work.
6. Top 10 Foreground Events by Total Wait Time:
This is another most important stats to consider while looking at AWR Report for any database performance related issue. This report is critical because it shows those database events that might constitute the bottleneck for the system. This has a list of top 10 foreground events arranged by Total Wait Time.
< !--[if !supportLineBreakNewLine]-->
< !--[endif]-->
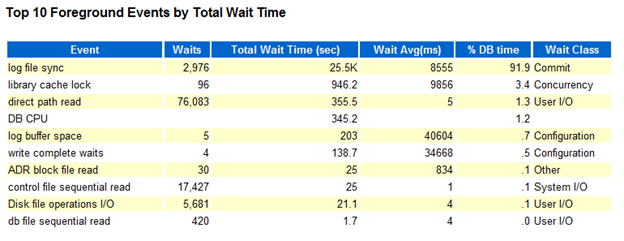
Here, first of all check for wait class if wait class is User I/O , System I/O, Others etc this could be fine but if wait class has value "Concurrency" then there could be some serious problem. Next to look at is Total Wait Time (sec) which show how many times DB was waiting in this class and then Wait Avg (ms). If Total Wait Time(sec) are high but Wait Avg(ms) is low then you can ignore this. If both are high or Wait Avg(ms) is high then this has to further investigate.
In the above screen shot, most of the resource are taken by Log file sync = 91.9% DB time and the wait class is “Commit”
In this report the event is "log file sync" which has high Waits, huge % DB time and large values in Total Wait Time (sec) and Wait Avg(ms) with wait class as commit. So, here you have to investigate further.
< !--[if !supportLineBreakNewLine]-->
< !--[endif]-->
Note : Use highest Total Wait Time(sec) to guide investigation.
Next are Wait Classes by Total Wait Time, Host CPU, Instance CPU, IO Profile, Memory Statistics, Cache Sizes are self-explanatory.
Point to remember while checking these results :
<!--[if !supportLists]-->Ø <!--[endif]-->Watch for number of CPUs
<!--[if !supportLists]-->Ø <!--[endif]-->Pay attention to changes in Memory size
<!--[if !supportLists]-->Ø <!--[endif]-->An idle CPU can be a bad thing
<!--[if !supportLists]-->Ø <!--[endif]-->Always look at Wait IO verses CPU usage
<!--[if !supportLists]-->Ø <!--[endif]-->If the system is IO bound CPU will be idle!
7. Shared Pool Statistics:
<!--[if !vml]--><!--[endif]-->
In general, Memory usage % statistics should be ~70% after the DB has been running a long time. If its quite low, memory is being wasted. Here in our report we have Memory Usage % ~50% which is good.
In case if we have this to ~90% or above as shared pool consumed. This could indicate that the system experiences some overhead while aging out old shared memory structures like cursors, PL/SQL programs, and so on. This will place additional overhead on the CPU to perform reparsing aging-out. The size of the shared pool should be increased appropriately to eliminate such overhead.
The % SQL with executions >1 statistics indicate how many SQL statements are executed more than one time. This measures how well the applications are tuned and how well they make use of Bind variables.
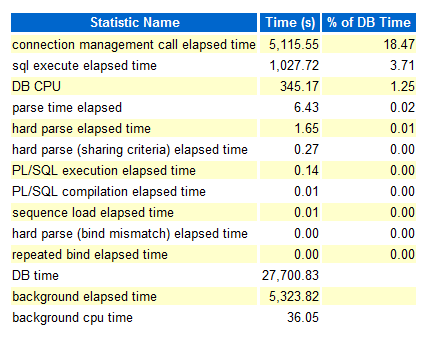
8. Time Model Statistics:This is a detailed explanations of system resource consumptions. Stats are order by Time (s) and % of DB Time.
Some times Sum of all % of DB time may be > 100%. why is this ?
Because this is cumulative time i.e. SQL execute elapsed time may show more DB time, which includes it sub parts like parse time elapsed, hard parse elapsed time etc. So, if you find Hard parse time elapsed is taking more %. So investigate further so on and so forth.
We have to look for stat which is taking abnormal % of DB time.
9. Operating System Statistics - Detail:
This is the information related to OS, what is the load status on System shown here.
< !--[if !supportLineBreakNewLine]-->
< !--[endif]-->
This report shows, system is 97 to 98% idle at time of report taken, So, there is no resource crunch at system level. But if, you found very high busy, user or sys % and indeed this will led to low idle %. Investigate what is causing this.
Next, very crucial part of AWR report is SQL Statistics which has all sql query details executed during report time interval.
We will explore few of them, To understand, how to analyzed these reports. Let's start with
10. SQL Ordered by Elapsed Time:
As explained by name itself, this lists SQL queries ordered by Elapsed time into reported time interval.
< !--[if !supportLineBreakNewLine]-->
< !--[endif]-->
<!--[if !vml]--><!--[endif]-->
In this report, look for query which has low executions and high Elapsed time per Exec (s) and this query could be a candidate for troubleshooting or optimizations.
Important point: some times executions may show 0, it doesn't mean query is not executing, this might be the case when query was still executing and you took AWR report. That's why query completion was not covered in Report.
11. SQL Ordered by CUP Time:
In this report, SQL queries are listed on the basis of CPU taken by the query i.e. queries causing high load on the system. The top few queries could be the candidate query for optimization.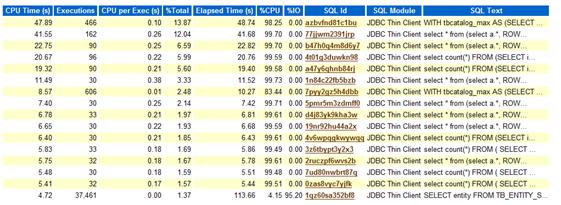
From above stat, look for queries using highest CPU Times,
However, there are so many other stats in AWR Report which needs to be considered; here I have listed the most commonly used stats for any performance related information.